To generate a robust and reliable library, all the spectra included in the database were measured using the same instrumental configuration and acquisition conditions. All spectra are based on a single acquisition (the experimental conditions were chosen in a way that statistical fluctuations in the spectra can be ignored). In real practice, depending on the object under investigation, the measurement set-up can vary or be far off from the optimal experimental conditions, especially for measurements carried out directly in situ via portable techniques.
Based on the fact that we aimed to develop a spectral database of reference materials, we decided to go with optimal experimental conditions in order to achieve high-quality spectra, with minimal noise. Spectra acquired via fiber optic spectrometers, such as Raman analysis in our case, are typically lower in quality compared to those from benchtop equipment.
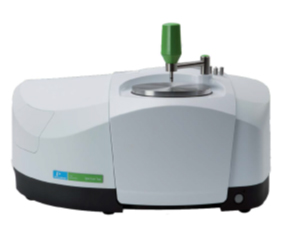
The FTIR spectra were registered in attenuated total reflection (ATR) mode, using a SpectrumTwo FTIR spectrometer (PerkinElmer, Waltham, MA, USA) equipped with a GladiATR accessory (monolithic diamond ATR crystal from Pike Technologies). Spectra were collected in the 4000-380 cm-1 mid-infrared spectral region at 4 cm-1 resolution. A total of 128 scans were used for an optimal signal-to-noise ratio1. Samples were applied directly on the ATR crystal, with no sample preparation prior to spectral measurements. Before each measurement, the ATR crystal was cleaned using isopropanol and optical wipes. All FTIR spectra have been baseline corrected and are plotted in percent transmittance (%T).
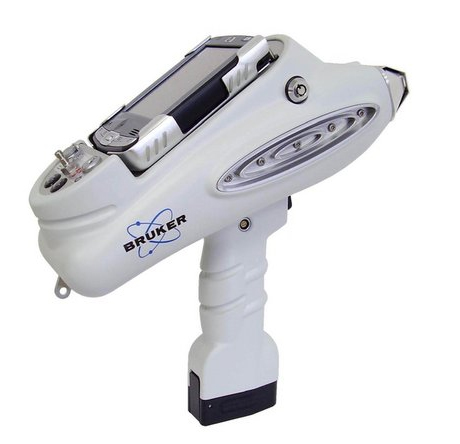
XRF measurements were performed using a TRACER III-SD portable energy-dispersive instrument from Bruker, provided with an Rh anode X-ray tube and a 10 mm2 X-Flash Silicon Drift Detector (SDD), with an energy resolution of approximately 147 eV for the Mn Kα line at 200,000 cps. For powder samples, approximately 5 g was used for each sample, to simulate an infinite layer thickness2, placed directly onto Mylar film, and exposed to X-rays for 300 s. The detection mode was universal, optimized for the mid-energy range of the 0-40 keV domain, experimental parameters being set at 40 kV tube voltage, ~11 μA current intensity, with no filtering of the incident beam, in air atmosphere. The instrument's detection limit varies for each element as a function of the physics of the sample, down to ppm level.
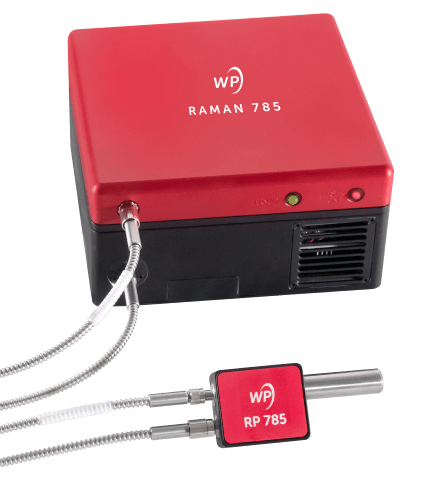
Raman spectra were recorded using a Wasatch Photonics system (WP 785 ER Raman) equipped with a standard fiber optic probe, providing a spatial resolution of 7 cm-1. A near-infrared diode laser (785 nm) was employed as the excitation source. The laser spot size is ̴ 170 μm, while the collection area is 1 mm diameter at 11 mm working distance (lens to sample). Acquisition time was on the order of 5 s and the laser power on the order of a few mW on the samples. The Raman spectra were acquired on solid samples without any sample pre-treatment3. Some of the investigated materials could not be characterized because of the strong luminescence they exhibit with the 785 nm excitation wavelength. All the spectra have been acquired in the absence of room lights to avoid any interference.
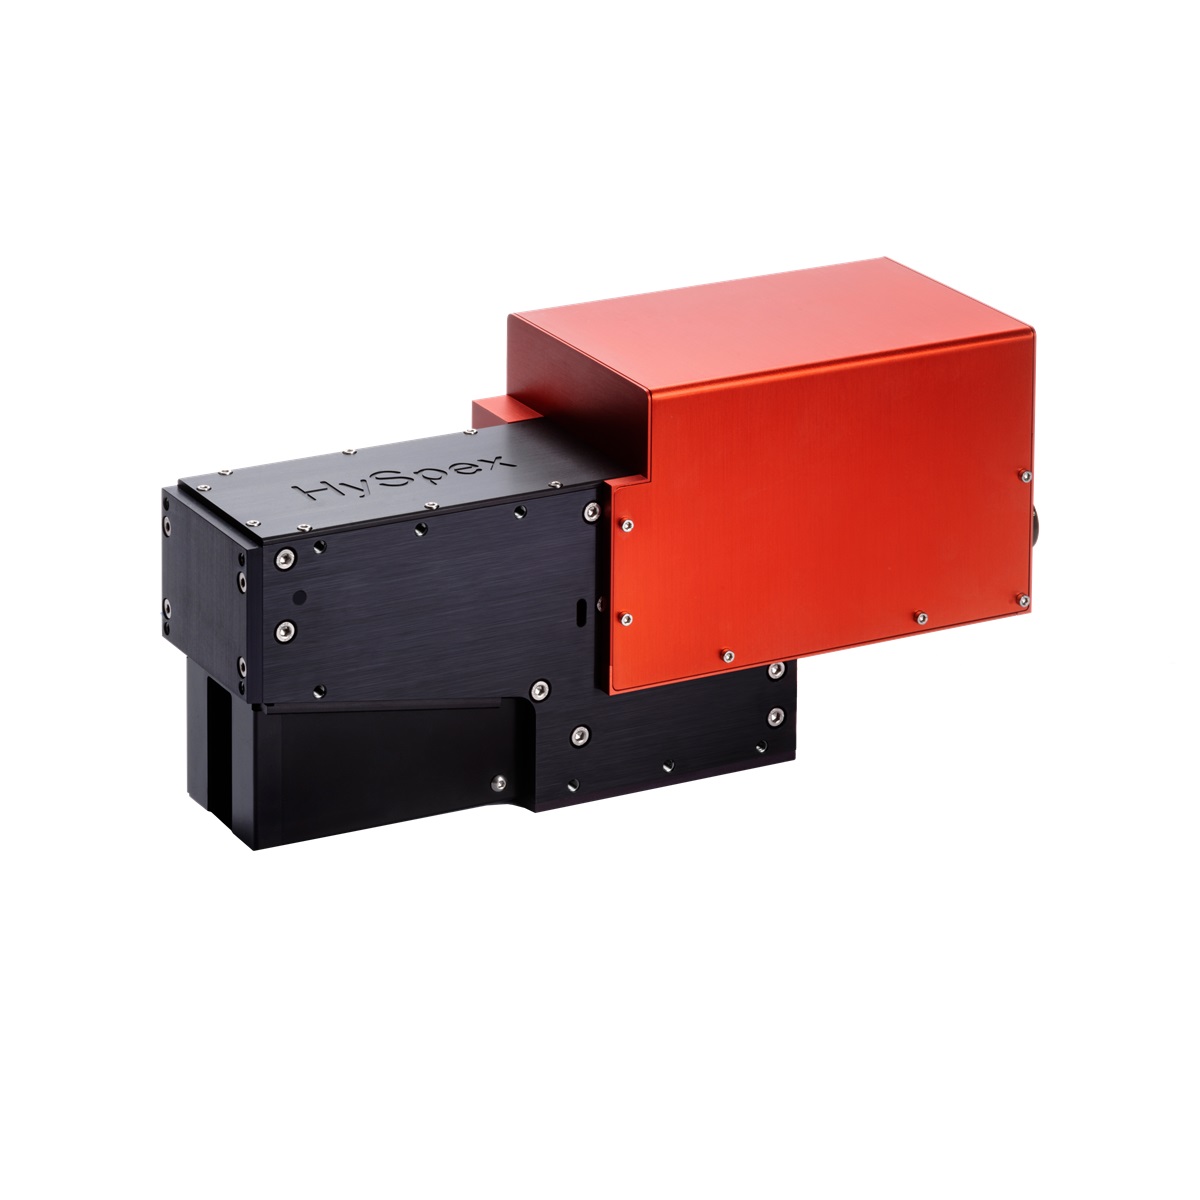
The hyperspectral data acquisition was performed using a HySpex SWIR-384 hyperspectral camera from NEO (Norsk Elektro Optikk) equipped with a state-of-the-art mercury cadmium telluride (MCT) detector. Samples have been evenly illuminated using an optimal wavelength lamp system, and scanning was performed in pushbroom mode, through the controlled sliding of the camera along an automated translation rail. Each recording involved the simultaneous acquisition of 288 spectral bands within the 930 to 2500 nm spectral range, with a spectral sampling interval of 5.45 nm. For the best available resolution, a 30 cm lens was used. The spatial resolution of the imaging data is 0.73 mm per pixel and the field of view across track is 16°. Data processing was carried out in ENVI. Raw data, stored as digital numbers, were automatically convert to reflectance using a set-up routine.
1 For the FTIR measurements, the 128 scans allowed us to obtain a nice smooth spectrum. A high number of scans is also required for functional groups with weak signal, so that the peak can be seen.
2 In the case of the XRF measurements, we decided to go with experimental conditions that allow to register data that can be expanded into quantitative analysis (for quantitative analysis certain conditions must be achieved). In real practice, for qualitative analysis, of course users can use a lower amount of sample and lower acquisition times.
3 The Raman measurements are the closest to real case scenarios (measurements taken in situ). As mentioned above, spectra acquired via fiber optic spectrometers, as in our case, are lower in quality (compared to those from a benchtop equipment). The only advantage in this case is given by the fact that all investigated samples were powdered so randomly oriented micro-particles theoretically express all Raman-active vibrational bands of a crystal structure in one measurement (in the case of minerals and related inorganic crystals).